
Why Ophthalmology
The Ophthalmology Succession Crisis: What The Data Actually Shows
Our last report covered the headline numbers. Roughly 18,000 actively practicing ophthalmologists in the United States, a projected 12% supply decline over the next decade, and a demand increase of 24% that turns those numbers into a 30% workforce gap by 2035. Those figures come from federal projections and residency match data, and they paint a clear enough picture on their own.
But they only tell you the size of the problem. They do not tell you where it is concentrated, which subspecialties are most exposed, or how quickly the wave of retirements will actually hit. To answer those questions, we went deeper.
We pulled provider level data from the CMS National Provider Registry and CMS Care Compare physician datasets, covering over 36,000 ophthalmologists with active federal enrollments and more than 20,000 confirmed graduation years.
That broader number includes physicians in part-time practice, administrative roles, and those winding down but still registered, which is why it is larger than the commonly cited 18,000 figure for full-time practitioners.
The value of the registry data is that it captures the physicians in transition, the ones who have not fully retired but are no longer operating at the pace they once were, and many of them still have practices attached to their name.
Among those registrations, approximately 9,000 are solo practitioners. They own and operate their own practice without a larger group or hospital system behind them. They built something from the ground up, hired their own staff, signed their own leases, and spent decades seeing patients under their own name.
More than 5,700 of those solo practitioners are 55 or older. That is 63% of every solo ophthalmologist in the country approaching the end of their career within the next ten to fifteen years, and the vast majority of them have no succession plan in place.
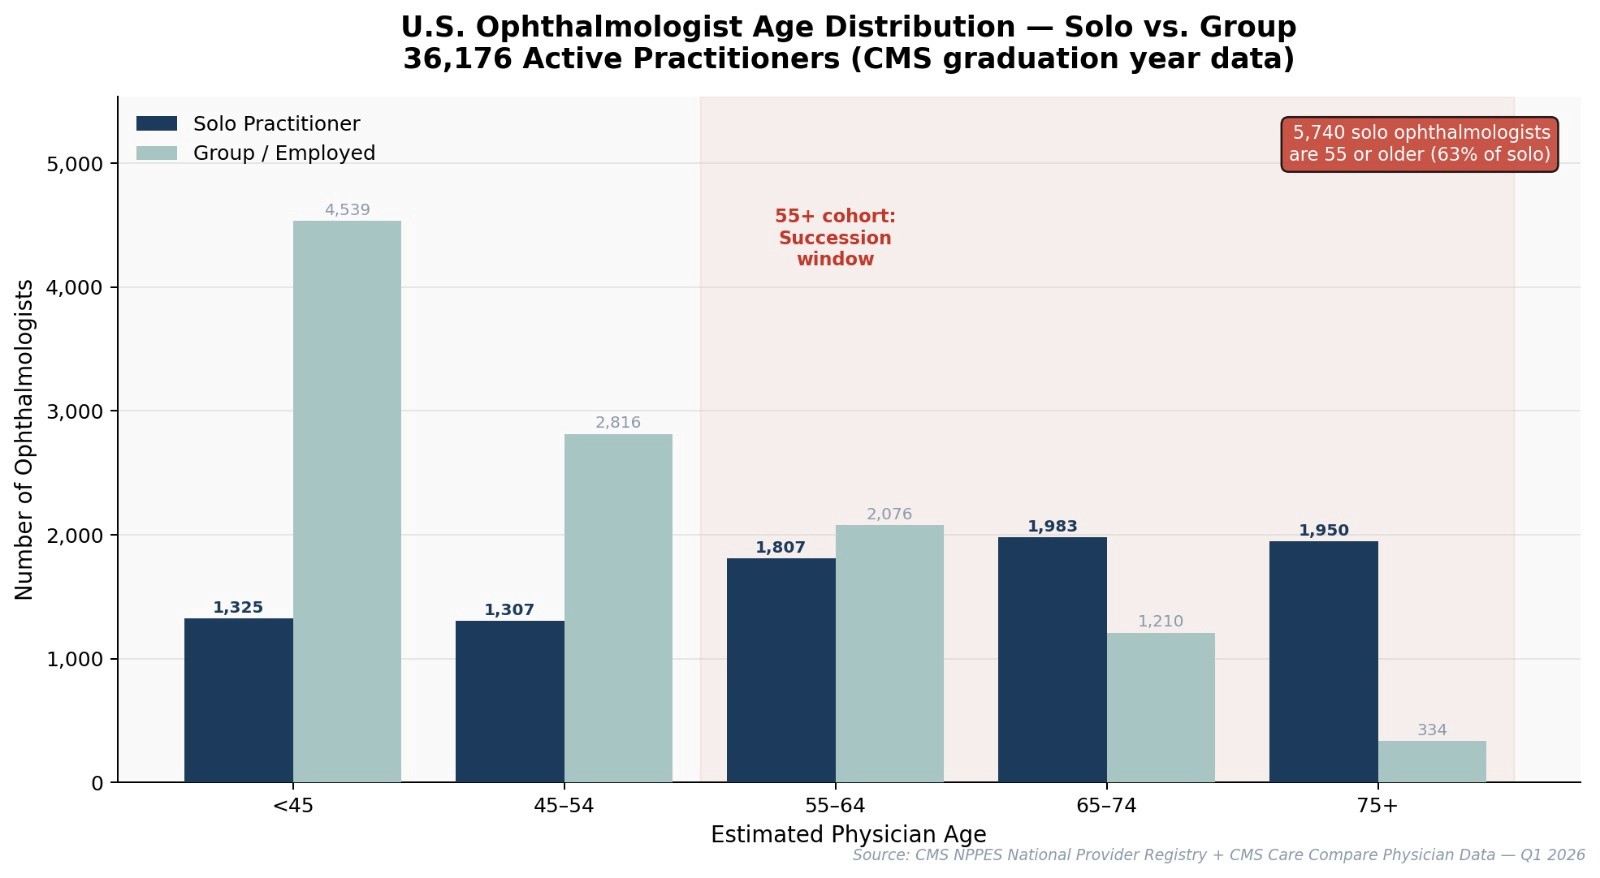
The age distribution tells the story clearly. Among solo practitioners with known graduation years, nearly two thirds are already in the succession window. The 55 to 64 cohort alone accounts for 1,807 solo ophthalmologists nationally, and the 65 to 74 cohort adds another 1,983. There are even 1,950 solo practitioners estimated to be 75 or older who are still actively registered and seeing patients.
The other side of the chart is where it gets worse. Younger ophthalmologists are not replacing solo practitioners at anywhere near the same rate. The under 45 cohort is heavily concentrated in group and employed settings, not solo practice. For every solo ophthalmologist under 45, there are more than three in a group or hospital system. The pipeline of physicians who want to own and operate their own practice is shrinking at exactly the moment the generation that built those practices is getting ready to leave.
The Practices That Built Ophthalmology Are the Most Exposed
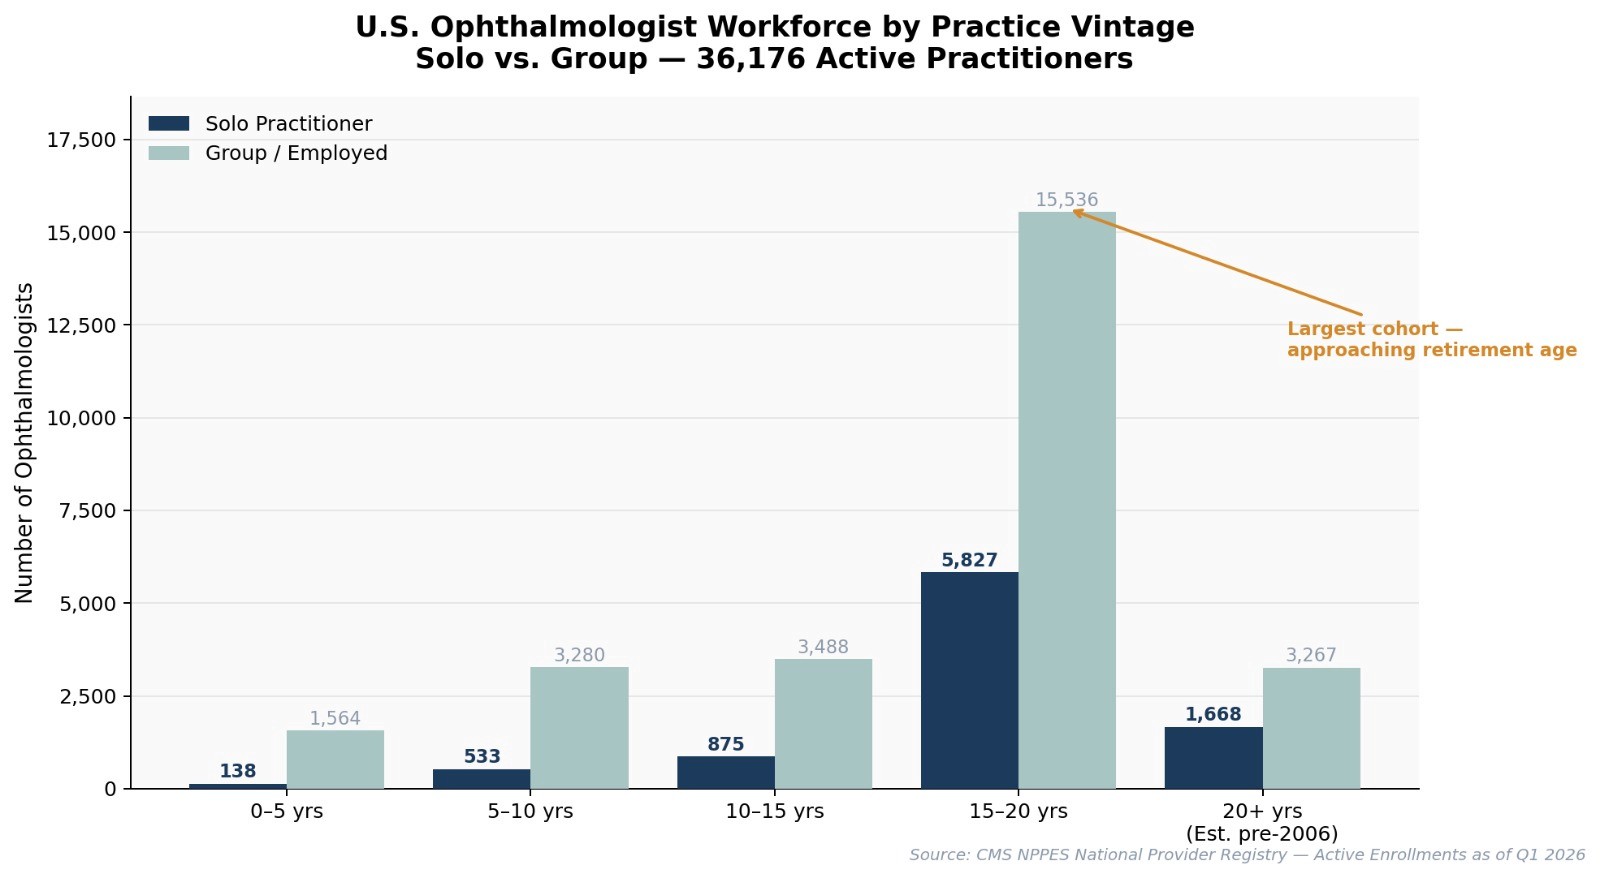
When you look at the data by how long practices have been operating, the concentration becomes even more striking. The largest single cohort in the entire national ophthalmology workforce is the 15 to 20 year practice vintage, and within that group there are 5,827 solo practitioners. These are physicians who opened their doors between roughly 2006 and 2011 and have been running their practices for close to two decades.
They are deep into their careers, approaching the age where retirement becomes a real conversation, and most of them have never seriously thought about what happens to their patients and staff when they stop.
The 20 plus year vintage adds another 1,668 solo practitioners who have been operating for more than two decades. These are the practices with the longest patient relationships, the most established referral networks, and in many cases the most outdated operational infrastructure. They are also the ones with the least time to plan a transition.
Meanwhile, the newer vintages tell a different story entirely. Only 138 solo ophthalmologists have been in practice for five years or less, compared to 1,564 in group settings over the same period. The ratio of solo to group among new entrants is roughly one to eleven. The next generation of ophthalmologists is choosing employment and group practice overwhelmingly, which means the pool of potential buyers for solo practices is getting smaller every year.
Where the Senior Solo Ophthalmologists Are
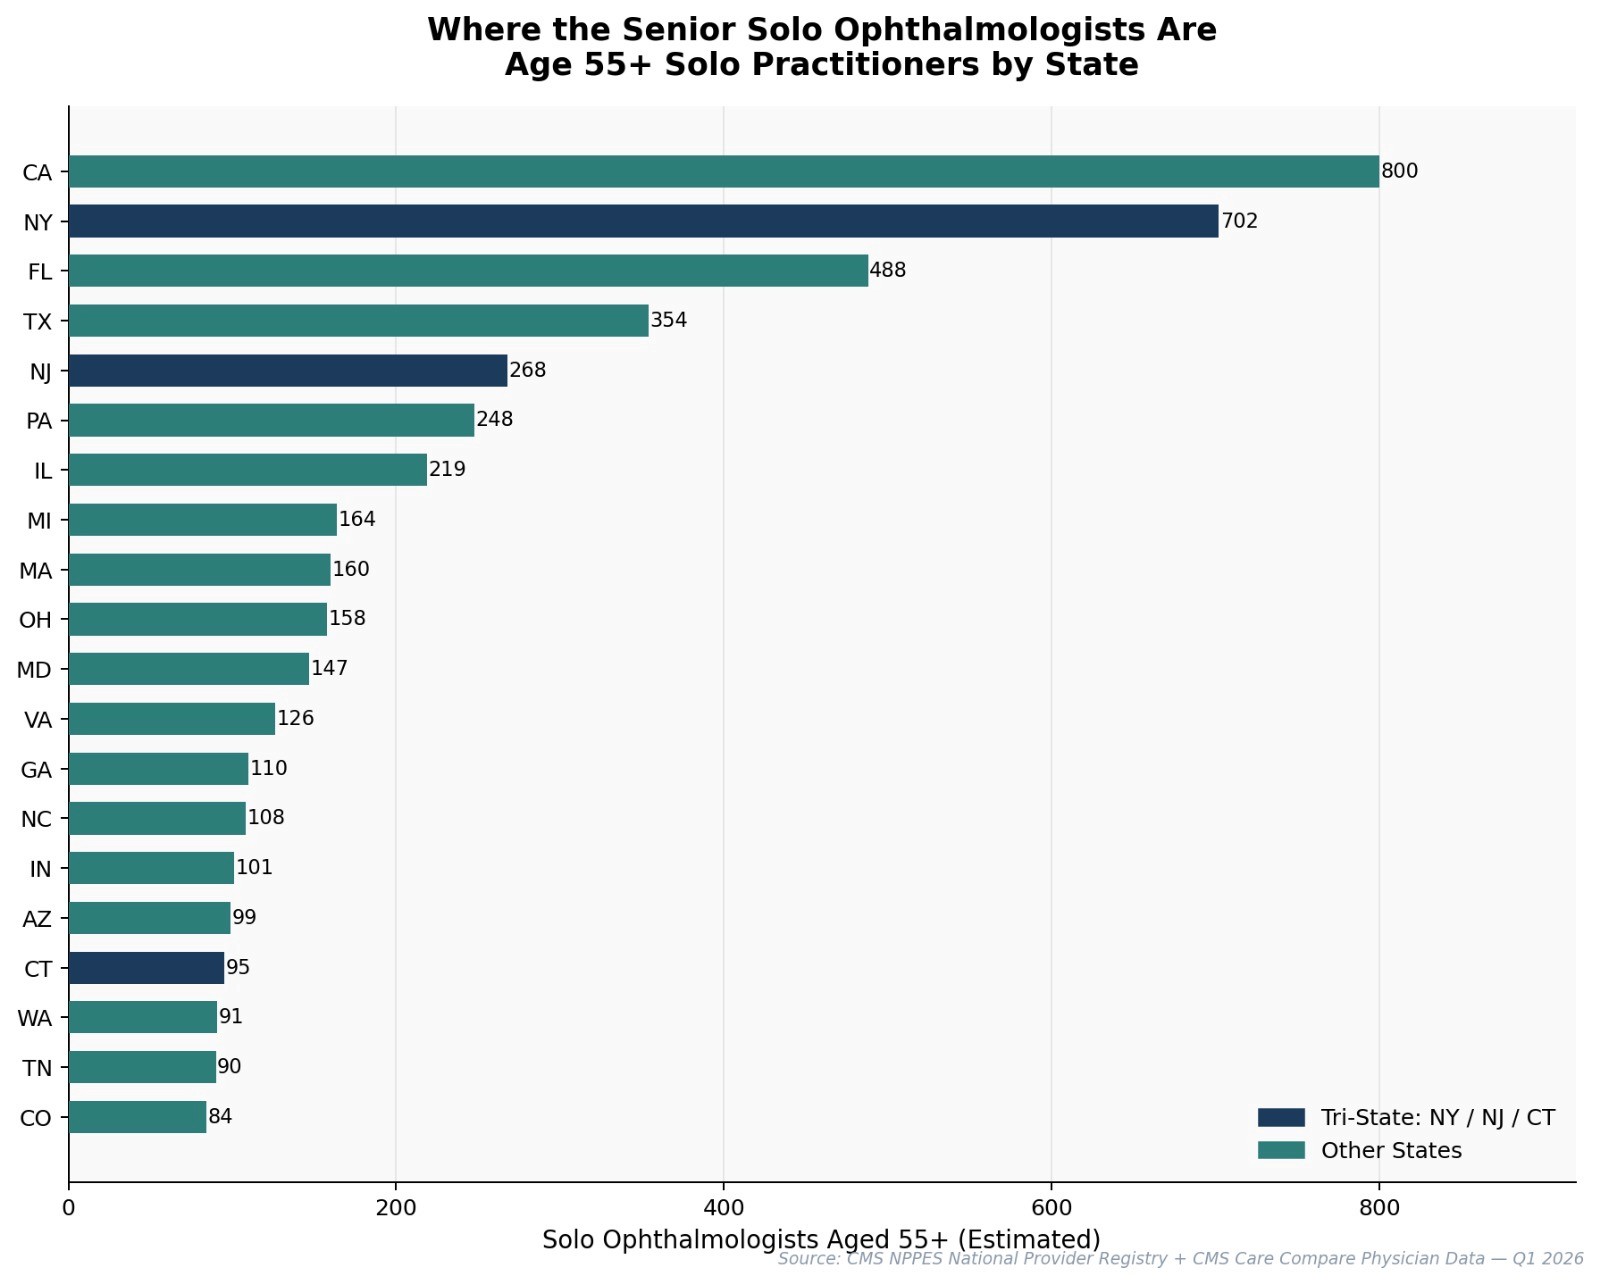
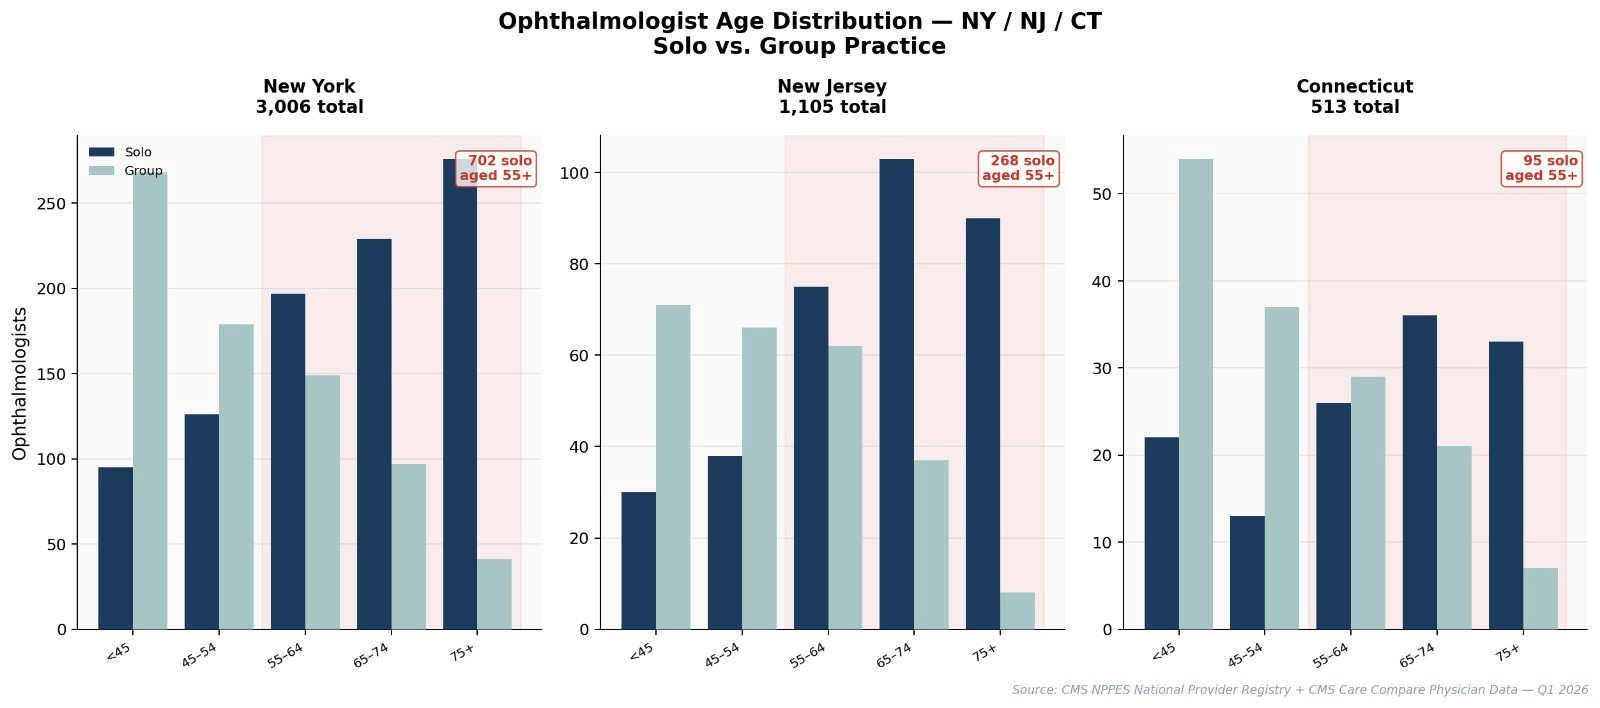
The geographic distribution of senior solo ophthalmologists is not uniform. California leads with approximately 800 solo practitioners aged 55 or older. New York follows closely at 702. Florida sits at 488, Texas at 354, and New Jersey at 268. These five states alone account for nearly half of every senior solo ophthalmologist in the country.
What stands out is the density in the Northeast corridor. New York, New Jersey, and Connecticut combined represent over 1,000 solo ophthalmologists aged 55 or older in a geographic footprint you can drive across in three hours. These are not rural practitioners spread across vast distances.
They are concentrated in suburbs and mid-size cities where patient panels are large, referral relationships are deep, and the practices themselves often represent millions of dollars in annual revenue.
When multiple practices in the same region begin closing within a short window, patients get displaced in waves. But that same density means a structured acquirer with the right clinical leadership can absorb multiple transitions without starting from scratch.
The Tri-State Picture
New York alone has 3,006 active ophthalmologists, 981 of whom are solo practitioners. Of those solo practitioners, 702 are estimated to be 55 or older. That means roughly 72% of solo ophthalmologists in New York are within the succession window.
The chart shows this visually — the dark bars representing solo practitioners grow dramatically relative to group practice bars as you move into the older age cohorts. In the 65 to 74 and 75 plus groups, solo practitioners actually outnumber group employed physicians in New York. The physicians who stayed independent the longest are now the ones closest to exit.
New Jersey follows the same pattern at a smaller scale, with 1,105 total ophthalmologists, 346 solo, and 268 of those solo practitioners aged 55 or older. Connecticut is the smallest of the 3 with 513 total, 137 solo, and 95 solo practitioners aged 55 or older. But proportionally, Connecticut may be the most acute because the state's geography means fewer practices need to close before patients start feeling the impact.
The practice vintage view of the tri-state area reinforces the national pattern but with sharper edges. In New York, the 15 to 20 year vintage cohort contains 711 solo practitioners compared to 1,251 in group settings. In New Jersey, that same cohort has 256 solo and 505 group. The cliff between the 15 to 20 year vintage and the newer cohorts is steep. New York has only 8 solo practitioners in the 0 to 5 year vintage. In a state with nearly a thousand solo ophthalmologists. That number tells you everything about where solo practice in New York is headed.
Subspecialty Matters
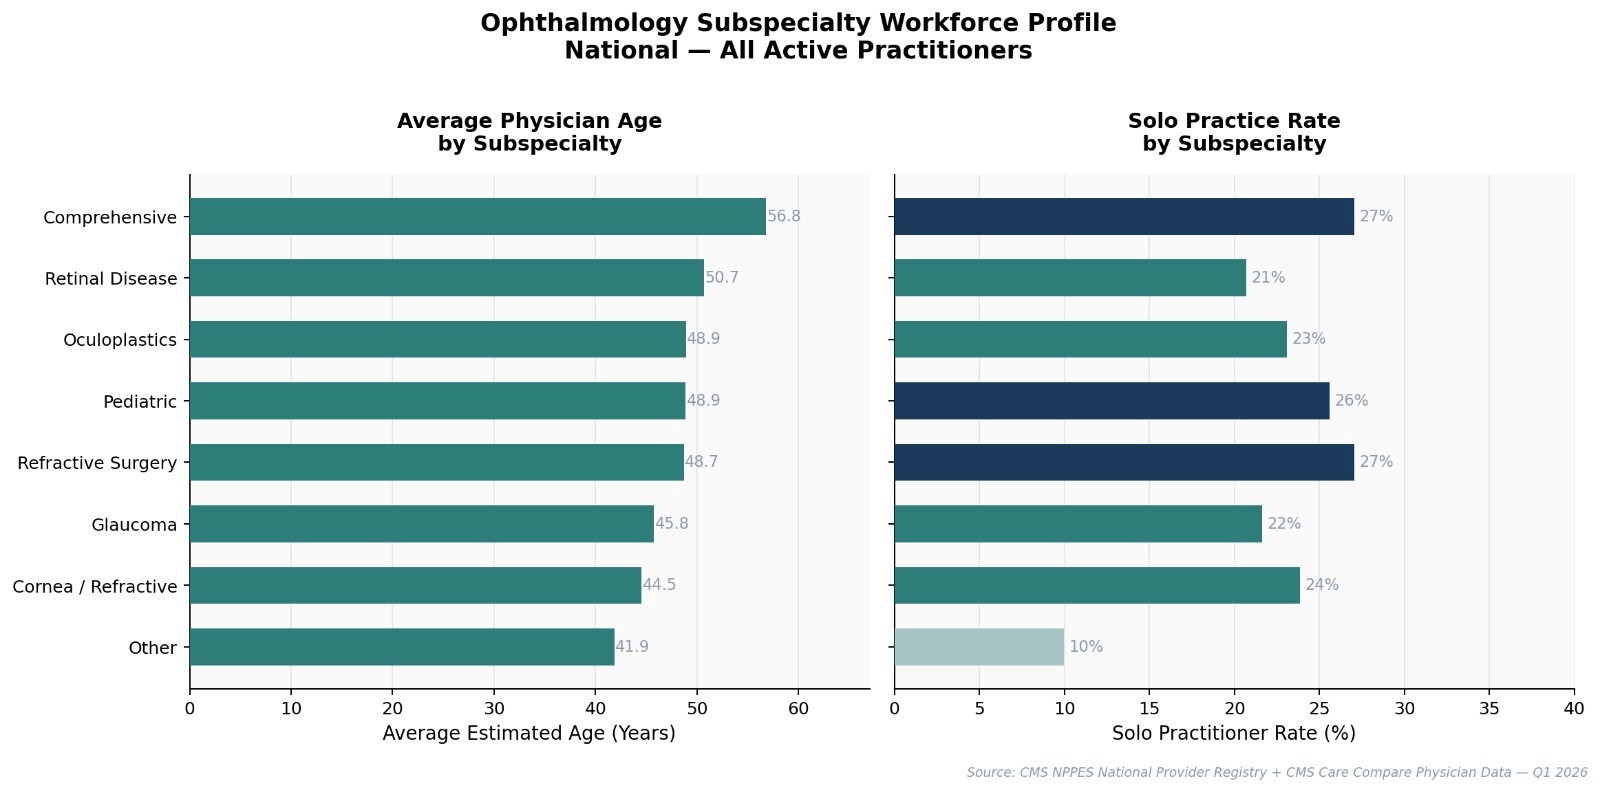
Not all subspecialties are aging at the same rate. Comprehensive ophthalmology has the oldest average physician age at 56.8 years, which makes sense because comprehensive is where many physicians land after decades of broad clinical work.
But the solo practice rates reveal something more nuanced. Refractive surgery and comprehensive ophthalmology both have the highest solo practice rates at 27%, meaning more than a quarter of all practitioners in those subspecialties are running their own shops. These are the cash pay dominant specialties where revenue comes from procedures like LASIK, premium cataract surgery, and lens implants rather than Medicare reimbursement.
High solo rates plus aging practitioners means one thing: a lot of practices are going to need a plan at the same time. When a comprehensive ophthalmologist running their own shop retires at an average age that is already approaching 57, the patients in that practice have no automatic transition path. They're not part of a hospital system that reassigns them and they're not in a group where a younger partner takes over. They get a letter in the mail saying the practice is closing, and they figure it out on their own.
Retinal disease sits at an average age of 50.7 with a 21% solo rate. Glaucoma is at 45.8 with 22% solo. These subspecialties have more time, but they are not immune. The same structural forces that are hitting comprehensive and refractive surgery now will reach retina and glaucoma within ten years.
The Retirement Wave
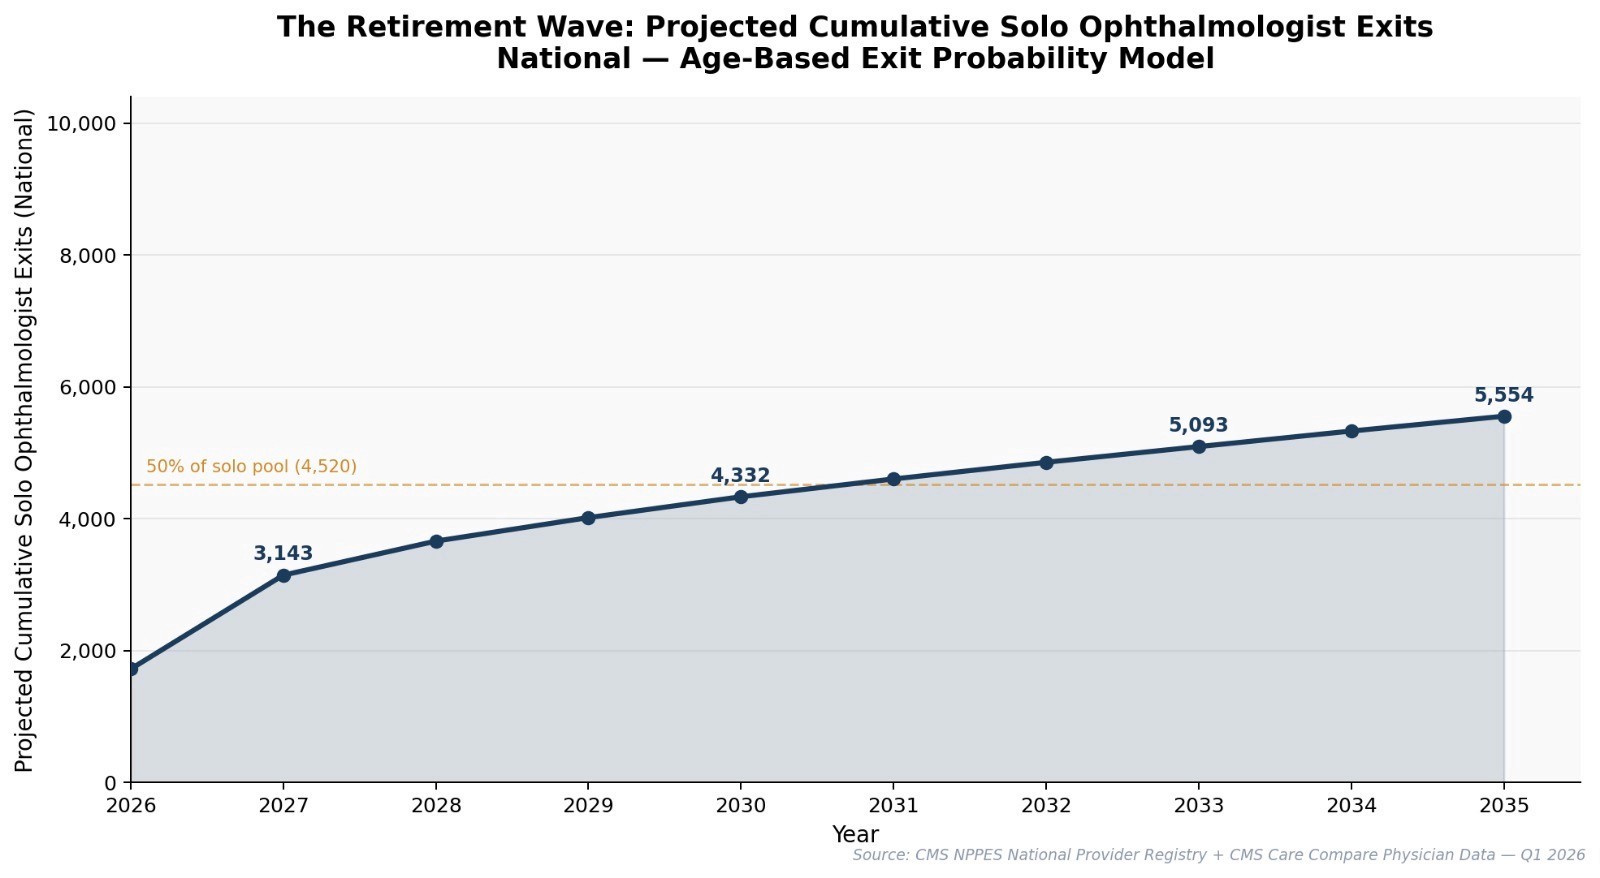
Using age based exit probability modeling across the full solo ophthalmologist population, the projected cumulative retirement curve shows an accelerating wave that is already underway. By 2027, approximately 3,143 solo ophthalmologists will have exited practice nationally. By 2030, that number reaches 4,332. By 2033, it crosses 5,093. And by 2035, the projection reaches 5,554 cumulative exits, which represents more than 60% of the current solo practitioner pool.
The curve is not linear. It accelerates between 2026 and 2030 as the densest cohort, the 15 to 20 year vintage physicians now in their late 50s and early 60s, begins transitioning out. After 2030, the rate continues but begins to flatten as the remaining solo practitioners skew toward those who have chosen to practice well past traditional retirement age.
The 50% threshold, meaning the point where half of all current solo ophthalmologists aged 55 and older have exited, is projected to land around 2036 to 2037 based on current trajectory. That's roughly a decade from now. Within that decade, more solo ophthalmology practices will change hands or close than in the entire previous generation.
What This Means
The data does not tell you what to do about it. But it does make the scale visible in a way that anecdotal conversations about "the aging workforce" never quite capture. This is a concentrated wave hitting a specific segment of a specific specialty in a specific geography, and the structural conditions that would normally absorb it, a pipeline of younger physicians interested in solo ownership, do not exist at anywhere near the necessary scale.
For solo practitioners reading this: the data answers whether the problem is real. The remaining question is what your own plan looks like and how early you are willing to start. The physicians who begin planning transitions 2 to 3 years before they need to leave will have options. The ones who wait until the wave has already crested will find a market that has moved past them.
For younger physicians considering ownership, the data shows a market that is about to create opportunities on a scale that has not existed in modern ophthalmology.
Thousands of established practices with existing patient panels, trained staff, and functioning revenue will need new leadership within the next decade. Whether that leadership comes from physicians or from financial sponsors treating the consolidation as an arbitrage play will shape what ophthalmology looks like in 2035.
We built Verdira because the window to do something about this is shorter than most people think.
Educational material only. Figures are illustrative and individual results vary. Images are AI-generated illustrations and do not depict actual Verdira practices, physicians, or patients. See our Disclosures.
All data in this report is derived from the CMS NPPES National Provider Registry and CMS Care Compare Physician Data as of Q1 2026. Age estimates are based on medical school graduation year plus 26 years, consistent with standard medical education timelines. Retirement projections use age based exit probability modeling and represent central tendency estimates, not individual predictions. Subspecialty classifications follow CMS taxonomy codes. Solo practitioner classification uses corrected ownership methodology accounting for incorporated practices that do not trigger the NPPES sole proprietor flag.

Written by
Verdira Team
Verdira is building a permanent home for ophthalmology practices. We write about succession, physician ownership, and the forces reshaping eye care in the United States.
Ready to secure your legacy?
We're here to ensure your hard work is valued and your business thrives as part of Verdira.
Disclosures
The content of this site is for general informational purposes only and is not intended to constitute an offer to sell or a solicitation to buy any security or other asset, or a promise to undertake or solicit business, and may not be relied upon in connection with any offer or sale of securities or other assets.
The content of this site is for general informational purposes only and is not intended to constitute an offer to sell or a solicitation to buy any security or other asset, or a promise to undertake or solicit business, and may not be relied upon in connection with any offer or sale of securities or other assets.
The content of this site is for general informational purposes only and is not intended to constitute an offer to sell or a solicitation to buy any security or other asset, or a promise to undertake or solicit business, and may not be relied upon in connection with any offer or sale of securities or other assets.
© 2026 Verdira Management NY, LLC